MapView Knowledge Base
1. Introduction
1.1 What
is MapView?
MapView is a Zoho CRM extension that transforms CRM data into real-time, interactive geographic insights. It enables users to visualize Leads, Accounts, Contacts, Deals, Vendors, and Custom Modules directly on a map, helping organizations identify sales patterns, under-served regions, and geographic trends that are not apparent in list views or traditional reports.
1.2 Key Benefits
1.2.1 Geographic Data Visualization
Transforms CRM records into spatial insights by plotting leads, accounts, contacts, deals, and custom modules on interactive maps, making regional performance and distribution instantly visible.
1.2.2 Territory Management for Performance Optimization
Enables businesses to define, visualize, and manage sales and operational territories directly on the map. By mapping CRM data to specific territories, decision-makers gain clear visibility into regional performance, can balance workloads, identify coverage gaps, and align resources more effectively. This geographic territory intelligence supports smarter planning, stronger accountability, and data-driven expansion strategies.
1.2.3 Heat Maps and Bubble Analysis
Identifies high and low-performing regions using density-based heat maps and strategic bubble maps, enabling effective trend analysis, demand forecasting, and informed territory planning.
1.2.4 Real-Time Business Intelligence Widgets
Provides real-time metrics and KPIs directly within the MapView interface, dynamically updating based on applied filters and user selections. This enables instant performance visibility without the need to switch between dashboards.
2. Getting Started
2.1 Download & Install
MapView is available on the Zoho Marketplace and can be purchased directly through monthly or yearly subscription plans. To help users make an informed decision, a trial version is also available, allowing them to explore the full functionality before committing to a subscription.
2.2 Pre-Requirements
- A valid Zoho CRM account with administrative access
- Compatible Zoho CRM edition (Enterprise or above)
- MapView subscription or free trial enabled
2.3 Installing MapView
- Log into Zoho CRM
- Navigate to Marketplace > All
Depending on your CRM view, the placement of the Marketplace icon may vary. The images illustrate the possible locations. - Search for MapView for Zoho CRM and click to start a free trial or buy now.
- Follow on-screen prompts to agree to the terms and select user
profiles for installation.
- Complete installation. MapView appears within CRM navigation once
enabled.
2.3.1 Initial Configuration
2.3.1.1 After installation
- Open MapView interface
- Connect CRM Data Modules (e.g., Leads, Contacts)
- Define or confirm address field mapping (essential for
geo-plotting)
2.3.1.2 Integrations
2.3.1.3 CRM Integration
MapView supports connectivity with a couple of CRMs, Zoho CRM and HubSpot CRM. This enables the users to visualize and analyze customer data from multiple platforms within a single interface. This dual-CRM integration eliminates data silos and provides a unified geographic view of sales and customer information in the same platform. This gives a greater flexibility, scalability, and adaptability to meet evolving business needs.
2.3.1.3.1 Primary
By default the MapView will be integrated within the CRM, on which it is installed on. After the successful installation, the integration will be as below.
2.3.1.3.2 Secondary
To integrate a secondary CRM, follow the steps below:1. Navigate to Settings.2. Select Integration.3. Choose the secondary CRM and click Connect.
3 Data Syncing
3.1 CRM Data Synchronization
There are two ways to import data.
3.1.1 Sync via CRM
This applies to Leads, Accounts, Contacts, and Vendors. Selected records can be synced directly into MapView, with tags automatically applied during the synchronization process. These tags indicate whether the sync was successful (“Synced Successfully”) or provide the reason for failure, such as an invalid or missing address.
3.1.2 Sync via Widgets
By default, five modules are included. To import records, the available data import options will be displayed.
3.1.2.1 All Data
It synchronizes all data within the selected module, ensuring that the complete Zoho CRM data set is synchronized with MapView.
3.1.2.2 Query Data
Simplify and filter the data that has to be synchronized in the Query Data. For example, after choosing the necessary module, click the import button and then select the Query Data. After choosing the necessary field, apply the constraint.As demonstrated below, the user can easily apply the constraint through query data if they wish to include only the data where the industry is precisely given.1. To import data specified upon query/needs2. The required data will be as followField>Operator>Value
3.2 Sync List
The Sync List displays the real-time statuses of ongoing sync jobs, providing a clear overview of their progress. It highlights the success ratio, along with the number of missing addresses and invalid records, giving insights into data accuracy. For each job, it shows the modifier’s email, date, and the creation date of the sync job, allowing users to track who made changes and when. This feature ensures transparency and helps monitor sync performance efficiently.
4 MapView Interface Overview
4.1 Canvas
The primary workspace showing CRM entities plotted by location. Users can pan, zoom, and select map elements.
4.2 Views
4.2.1 Default View
The default view displays Leads, Accounts, Contacts, Vendors, and Deals using custom marker icons, labels, and color coding. However, to create a tailored view for a specific department or an individual, the configuration can be customized as outlined below.
4.2.2 Custom View
Custom Views enable the creation of tailored perspectives of CRM data that can be assigned to users based on their roles. Each view can be given a name and description to define its purpose clearly. Users can select the relevant modules to include, any specific territories and widgets which can be chosen to customize the view for different profiles. These views can then be assigned to users according to their roles, ensuring that each team member sees the most relevant data and tools for their responsibilities. This functionality enhances efficiency, personalization, and role-based access within the CRM.
4.2.3 Search Bar
Global search allows wildcard queries for records directly on the map. You can search within a module or across all modules.
5 Core Features
5.1 Bubble Map
Highlight geographic areas with circles (bubbles) centered on locations with configurable radius and color. Useful for denoting territories, target zones, or campaign regions.
5.2 Heat Map
A density-based visualization that uses heat signatures to reflect concentrations of CRM records (hotspots) for prioritized focus and trend analysis.
5.3 Territories
Define geographic territories manually or via address boundaries. Assign CRM data to these territories to align with sales zones, operational regions, or coverage planning.
5.3.1 Area-Based Territory
Area-Based Territories are defined using predefined regions, such as cities, states, or postal codes. This approach allows users to assign territories based on geographic boundaries and ensures structured coverage for teams.
5.3.2 Hand-Drawn Territory
Hand-Drawn Territories allow users to create custom regions by manually drawing boundaries on the map. This provides flexibility to define irregular or specific areas that may not align with standard geographic divisions.
5.4 Routing & Planning
Map out your journeys using MapView to generate an optimized route from your starting point to the final destination. You can also plan and share your route with others via a convenient link.To plan a route there are two different methods:
5.5 Hand Drawn Routes
Select a specific area by drawing a boundary using the Drawing Palette. Entire data within the selected area will appear in the destination dropdown, allowing you to plan routes from one data point to another within the defined boundaries.
Note: The Routes feature is a Pro functionality that requires additional paid subscription. However, the first five routes created by users are free of charge.After selecting a specific area and adding multiple destinations to define the starting and ending points, click the Get Routes button. The optimized route will be displayed on the map and saved as a shareable link, allowing you to share your route with others conveniently.
5.6 Destination-Based Routes
In addition to hand-drawn routes, the Destination-Based Routes functionality allows users to create routes by adding and selecting multiple destinations. Users can define a start point and choose several destinations, and the Route feature automatically generates an optimized route for efficient travel. These routes can be shared easily for collaboration or navigation purposes.· Select a start point and destination· Generate shareable routes· View driving patterns and route suggestions (this feature may vary based on your subscription)
5.7 Record Management on MapView
5.7.1 View & Select Records
Click any map marker to display record details and quick actions
5.7.2 Manage Labels
To customize the CRM-integrated data displayed on the map, users can multi-select through the Manage Label icon.
5.7.3 Edit Records
Editing via MapView syncs changes back to Zoho CRM instantly, retaining CRM integrity.
5.7.4 Delete Records
Deleting via MapView syncs changes back to Zoho CRM instantly, retaining CRM integrity.
5.8 Clusters
Clusters in MapView are dynamic, map based visual groupings that combine multiple nearby records into a single aggregated marker, when the map is zoomed out or when the record density is high. Instead of displaying numerous overlapping pins, MapView intelligently merges them into one interactive cluster indicator that represents multiple CRM records at once. This makes it easier to visualize large volumes of geographically distributed data.
5.8.1 Why Clusters Are Important
Clusters are essential when working with high-density, location-based business or CRM data. Without clustering, multiple records in close proximity overlap at lower zoom levels, reducing clarity and impacting usability. Clustering improves readability, minimizes visual clutter, enhances overall map performance, and enables structured exploration of large datasets. It ensures smooth panning and zooming even when handling thousands of records across dense areas or large-scale territories.
5.8.2 Functionality of Clusters
Clusters operate through intelligent grouping logic based on geographic proximity within a defined radius. When multiple records fall within a specific range, MapView automatically replaces individual markers with a single cluster marker that displays the total record count.Beyond basic grouping, clusters support advanced customization features, including:
- Module Selection – The user first selects a CRM module. Based on
this selection, cluster data dynamically reflects the chosen module’s standard
or custom fields. These fields determine how records are grouped, calculated,
and visually represented within the cluster.
- Customized Key Metrics
– After
selecting the module and relevant field, users can define a key metric and
apply an operator (such as sum, count, or average). This enables clusters
to display aggregated insights like total revenue, deal value, or record
count directly inside the cluster marker.
- Custom Colors – Users can assign
different colors to clusters based on selected field values, record
status, or predefined conditions. Colors can be chosen from a customizable
color palette, allowing clear visual differentiation between categories
and making patterns instantly recognizable on the map.
5.8.3 Functionality of Clusters
To create a new cluster configuration in MapView, start from the MapView main screen and click on the Settings button. From there, navigate to the Clusters section and select the Create New Configuration option located in the top-right corner. Next, choose the desired module and specify the field within that module on which you want to apply an operation such as Sum, Average, or other calculations. Finally, select your preferred color to visually distinguish and identify the different categories on the map.
6 Functionalities
6.1 Profile Info
The Profile Info section displays user information based on their CRM details.
6.2 Settings
6.2.1 General Settings
6.2.1.1 Theme Settings
MapView allows users to switch between light and dark themes using the toggle option available in the Theme Settings interface. The light theme is recommended for daytime usage, offering clear visibility of maps and data elements. The dark theme is designed for low-light or nighttime environments, helping to reduce eye strain and improve visual comfort. This theme flexibility ensures an optimized viewing experience based on user preferences and working conditions.
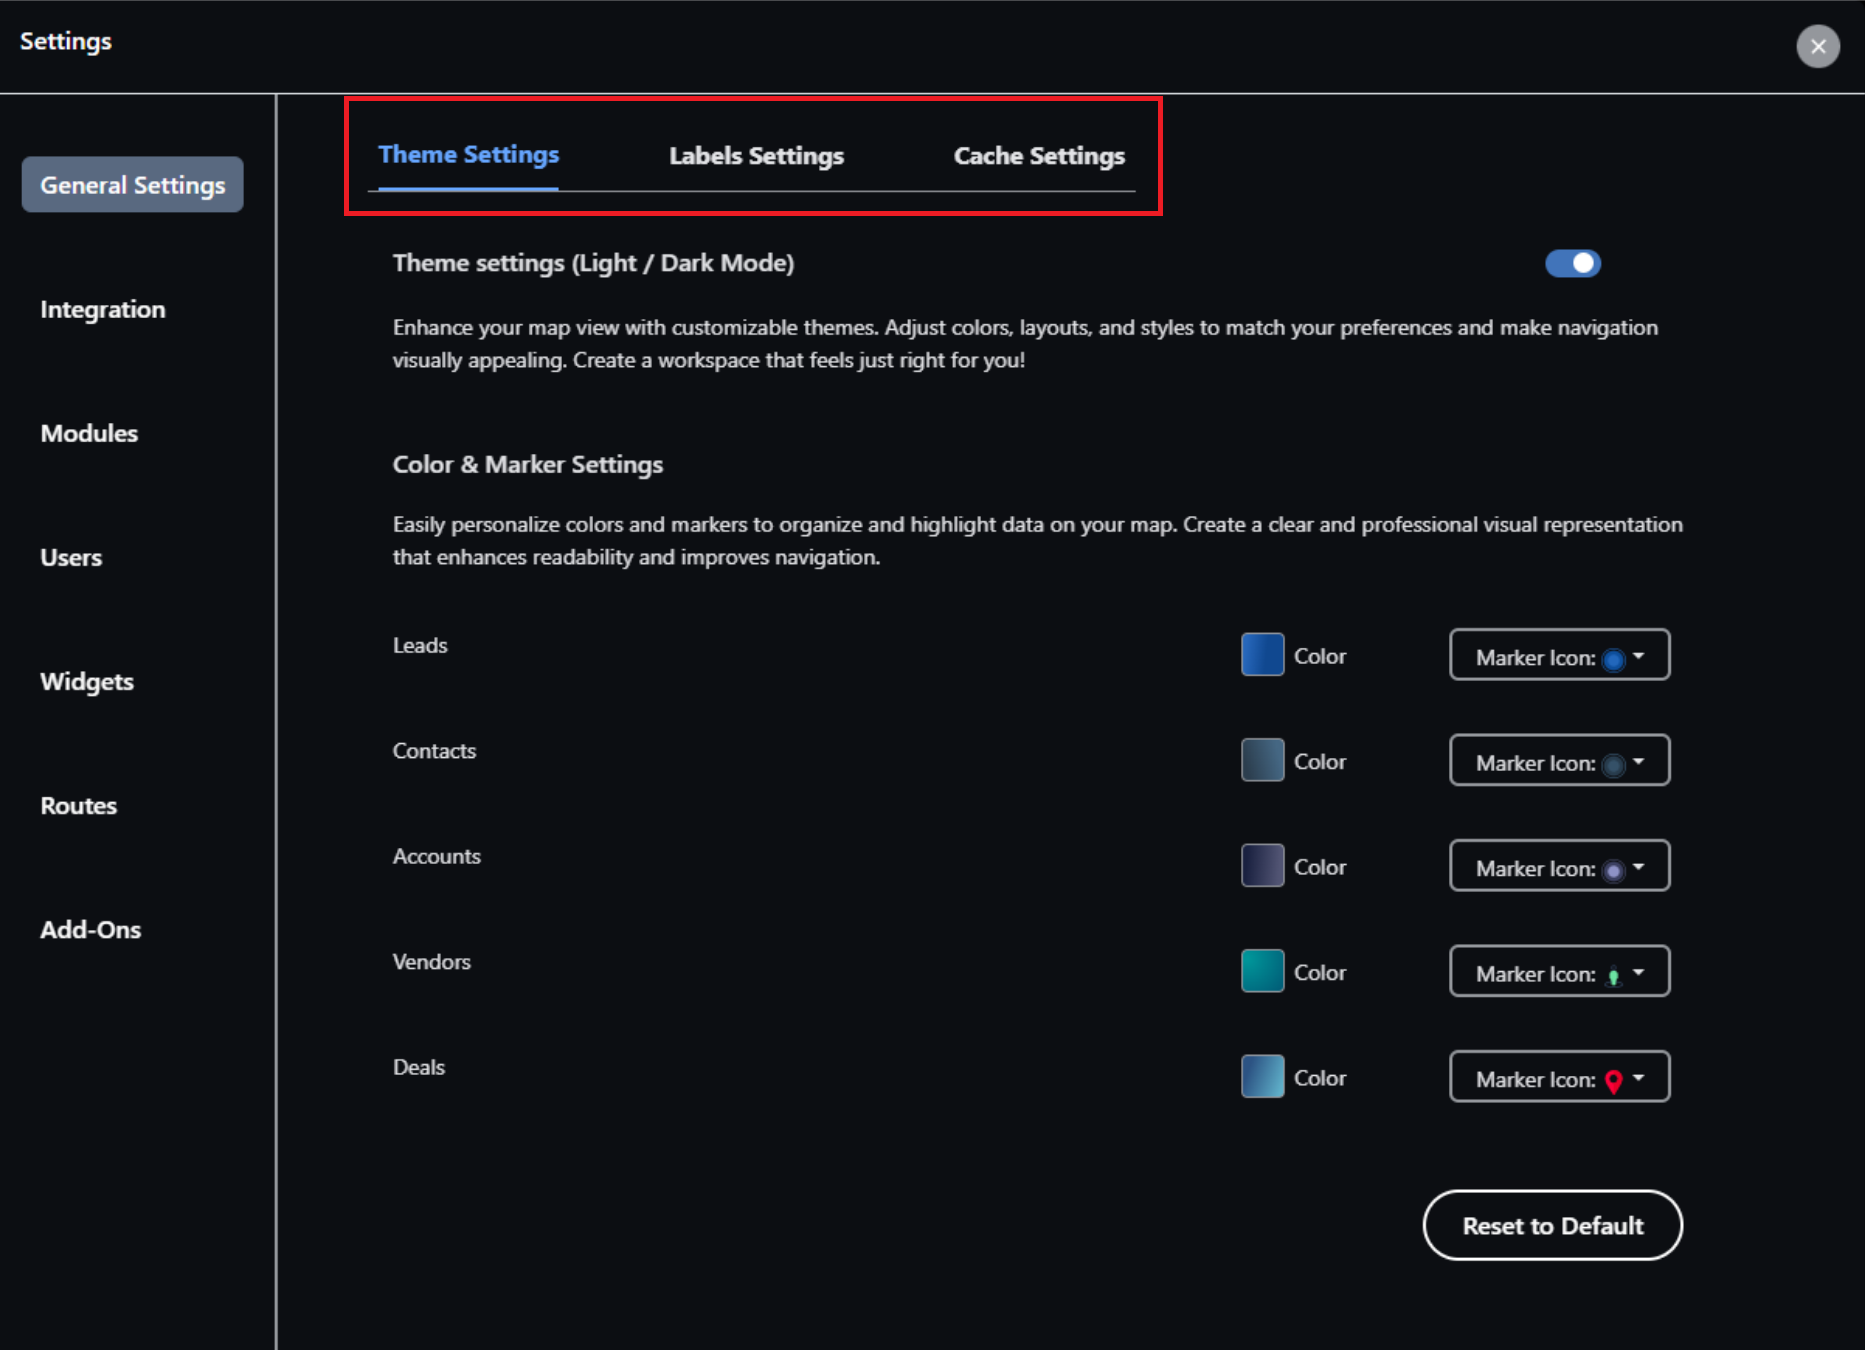 6.2.1.2 Label Settings
Label Settings allow you to select specific fields to be displayed as labels for records on the map. For example, if a user wants to view leads by their email addresses on the map, the lead label should be set to “Email”. Simply select the desired field from the dropdown and click “Update Changes” to apply.
6.2.1.3 Cache Settings
MapView cache settings control temporary data storage to optimize performance and loading speed. Clearing the cache refreshes configurations and ensures the latest data and module updates are correctly reflected.
6.2.2 Integration
MapView supports connectivity with multiple CRMs. Zoho CRM and HubSpot CRM are given by default for integration, however, for additional CRM integrations, please contact support at info@zenithinnovations.netThis gives a greater flexibility, scalability, and adaptability to meet evolving business needs.
6.2.3 Modules
Modules consist of relevant field records fetched from the CRM to be displayed in MapView. By default, five modules are provided, and additional custom data fields can be added to the map by creating custom modules.
6.2.3.1 Existing default modules
Existing default modules consist of Leads, Accounts, Contacts, Vendors, and Deals. Selected records can be synced directly into MapView.
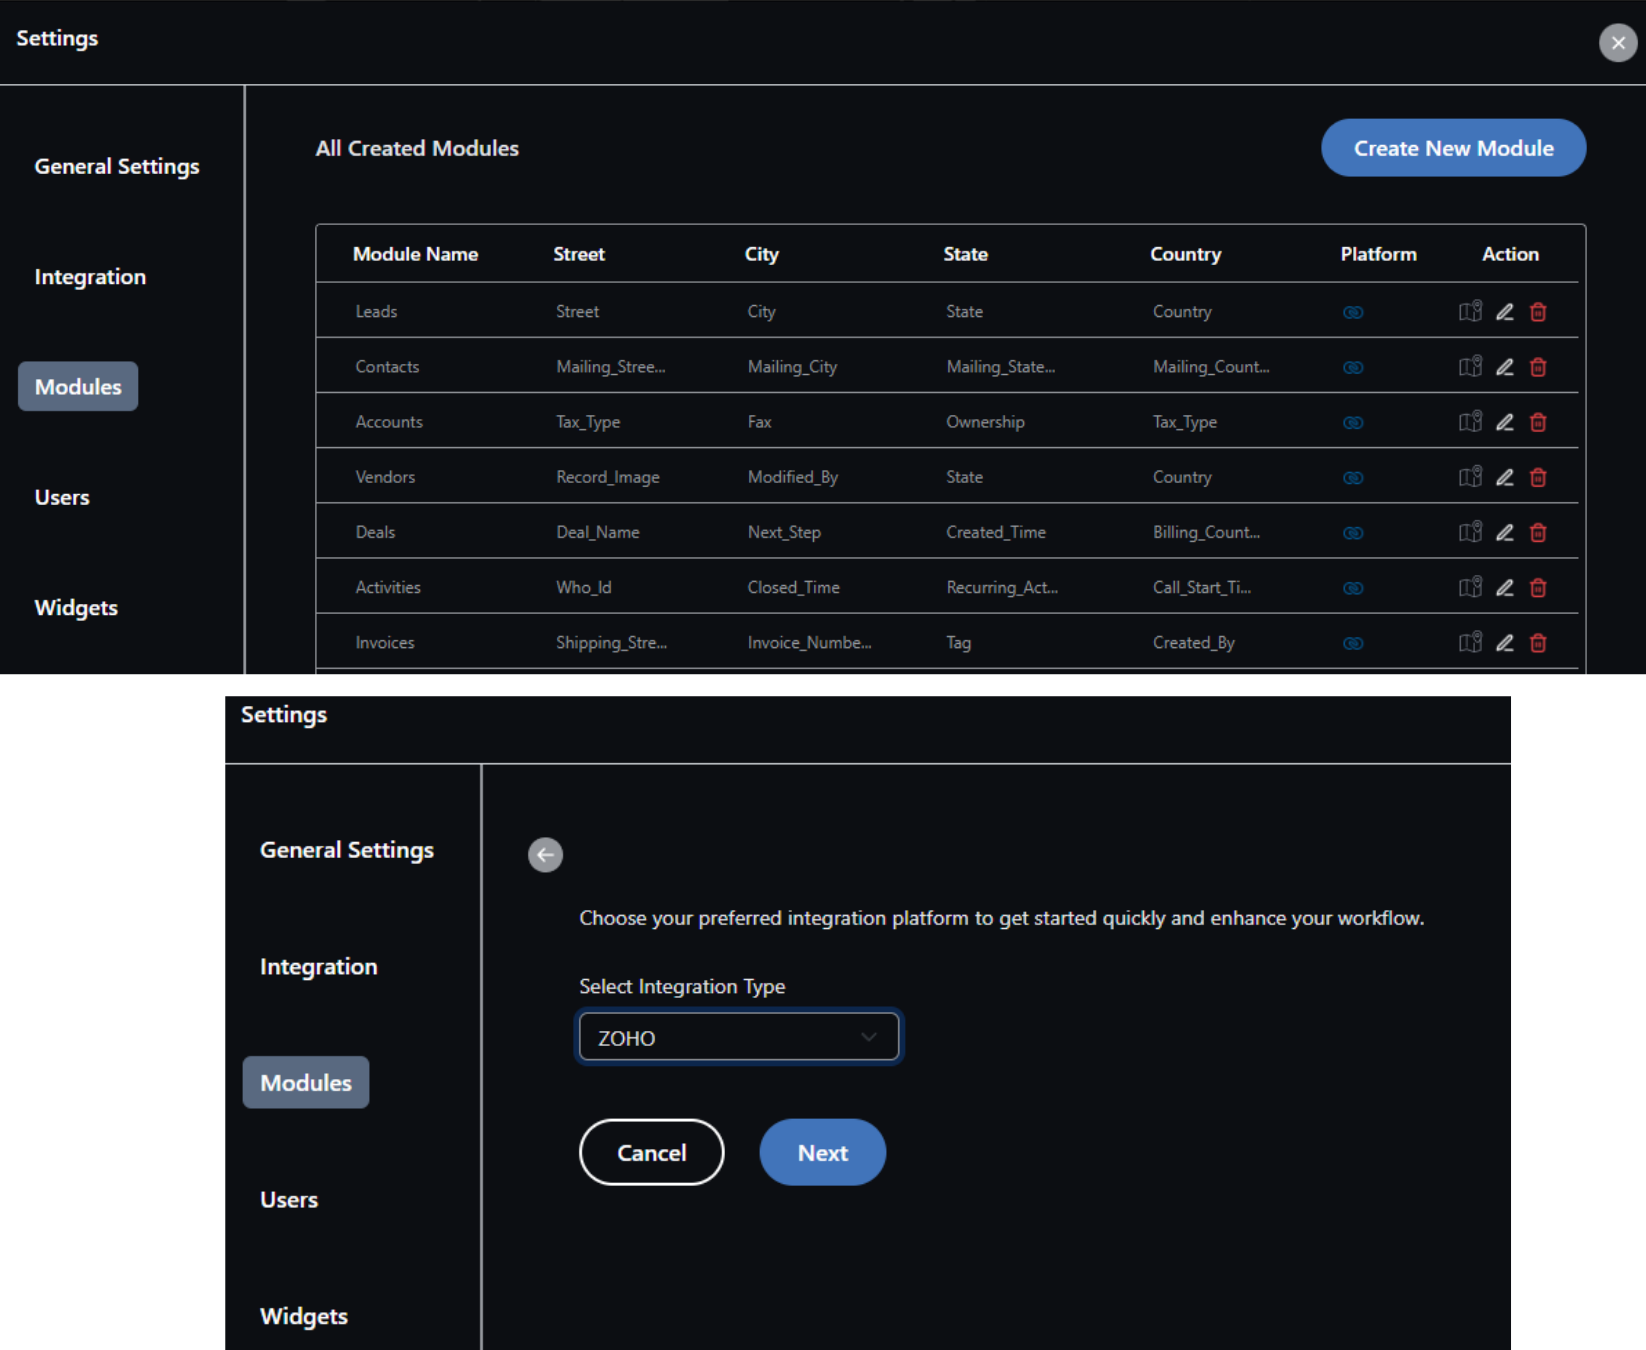
6.2.3.2 Create/Custom modules
To add custom modules:
- Navigate to Settings > Modules.
- Click the Create New Module button.
- Select the integration platform, which will display the relevant modules from the chosen platform.
- Choose the custom fields for the mandatory address components: Street, City, State, and Country.
6.2.4 Users
The platform allows 2 users by default as part the base plan. The Admin role is assigned to one user with full access to settings and configurations. Additional users can be added based on the active subscription, and any users beyond the base 2-users’ limit are available as pay-as-you-go. This ensure flexible user management while maintaining role-based access control according to organizational needs.
To add additional users (subject to the subscription plan), follow the steps below:i. Click Create New User.ii. Enter the following details:1. First Name2. Last Name3. Email4. Role
6.2.5 Widgets
The Widgets Module provides a flexible way to manage and customize widgets within your CRM. Each widget can be assigned a module name, a widget name, and a distinctive icon and color for easy identification. A short code can be used to reference the widget quickly in reports or dashboards. Users can control visibility, deciding who can access the widget within the organization. Additionally, widgets can be edited to update settings or formulas as needed, and deleted when no longer required. This module ensures that widgets are easy to manage, highly customizable, and tailored to provide relevant insights for different teams or roles.
6.2.5.1 Default Widgets
The default allowed limit is 5, however, additional widgets are subject to subscription.
6.2.5.2 Create new widget
The Create New Widget feature allows users to design custom widgets within CRM modules for a tailored dashboard experience. Users can start by providing a name, selecting an icon, and choosing a color to visually represent the widget. A formula can be defined to calculate values, with an optional short code for easy referencing. The widget can pull data from a formula field and can be created based on historical data to analyze past trends. Users can also select the appropriate data field according to the required duration, such as daily, monthly, or yearly metrics. Additionally, the feature supports data categorization, allowing segmentation of information based on the selected field, such as region, employee, or product. This ensures that the widget provides meaningful, organized, and actionable insights tailored to specific business needs.The data charts are generated based on the applied formula and can be further refined to display historical trends, categorized data, or both.
6.2.6 Routes
All the optimized routes, of your starting point to the final destination, are found under this tab which includes the route creation date with a route link and a hover icon to copy that link for sharing.To plan a route there are two different methods:
6.2.6.1 Hand Drawn Routes
Select a specific area by drawing a boundary using the Drawing Palette. Entire data within the selected area will appear in the destination dropdown, allowing you to plan routes from one data point to another within the defined boundaries.Note: The Routes feature is a Pro functionality that requires additional paid subscription. However, the first five routes created by users are free of charge.After selecting a specific area and adding multiple destinations to define the starting and ending points, click the Get Routes button. The optimized route will be displayed on the map and saved as a shareable link, allowing you to share your route with others conveniently.
6.2.6.2 Destination-Based Routes
In addition to hand-drawn routes, the Destination-Based Routes functionality allows users to create routes by adding and selecting multiple destinations. Users can define a start point and choose several destinations, and the Route feature automatically generates an optimized route for efficient travel. These routes can be shared easily for collaboration or navigation purposes.
- Select a start point and destination
- Generate shareable routes
- View driving patterns and route suggestions (this feature may vary
based on your subscription)
6.3 Add-Ons
6.3.1 Base Plan
The platform includes a set of base features that allow users to get started without any additional cost. By default, users can access 2 users, 5 modules, 5 widgets, 5 routes, and 5 bubbles as part of the base plan. It also includes 1,000 records, 2 territories, and 2 views, enabling basic data management and visualization. These free limits provide essential functionality for small teams or initial usage, while higher limits and advanced capabilities can be unlocked by upgrading through add-ons based on specific requirements.
6.3.2 Paid Add-Ons
The Add-Ons feature allows users to manage and customize additional capabilities based on their business needs, with flexible monthly or annual pricing options. All add-ons are available as Pro features, enabling users to select only what they require. These include Users, Records, Modules, Territories, Widgets, Views, Routes, and Bubbles. By choosing the relevant add-ons, organizations can enhance functionality, scale efficiently, and tailor the platform to match their specific operational requirements.
6.3.2.1 Billing History
The Billing History provides a comprehensive record of all subscriptions and payments made by customers. It displays the customer name, email, price, purchase date, and end date of each subscription, giving a clear overview of transactional details. The status indicates the current state of the subscription, including updates when add-ons are modified, showing that the existing subscription is cancelled and the new one is activated. This feature ensures transparency, accurate tracking, and easy management of all billing activities.1. Purchase Date2. End Date3. Status (Once the Add-Ons are updated, the existing subscription gets cancelled and the new ones get activated)
6.4 Support & Related articles
- Release Notes
- Frequently Asked Questions
- For any other queries please Submit Tickets
In case of any issues during setup or installation, please feel free to contact us at.
Related Articles
Map View for Zoho CRM - Release Notes
MapView for Zoho CRM – Release Notes Year 2025 Version 4.1 Published on: Dec 21, 2025 Release Overview This release focuses on improving clarity and accuracy in product documentation by refining release note descriptions. What’s New / Enhancements? ...MapView - Frequently Asked Questions - FAQs
MapView Frequently Asked Questions General & Introduction 1. What is MapView? MapView is a Zoho CRM extension that transforms CRM data into real-time, interactive geographic insights by plotting Leads, Accounts, Contacts, Deals, Vendors, and custom ...LeadFinder - Knowledge Base
Overview LeadFinder is an extension that helps users find leads or businesses by letting them use certain keywords, locations, and a set radius. The extension makes use of Google APIs, such as the Places API and the Maps JavaScript API. LeadFinder ...LinkedPro - Knowledge Base
1. Introduction to LinkedPro LinkedPro is an advanced Zoho CRM extension that allows users to search, view, import, and engage with LinkedIn profiles directly from within Zoho CRM. It streamlines prospecting, lead enrichment, company insights, and ...LinkedPro - Frequesntly Asked Questions - FAQs
PRODUCT BASICS 1. What is LinkedPro? LinkedPro is a Zoho CRM extension that lets you search, view, and import LinkedIn profiles directly from your CRM without leaving the platform. 2. Who developed LinkedPro? LinkedPro was developed by Zenith ...